Stock Investing Basics

Trading Basics

Illustration of financial growth, including coins, a piggy bank, bar graphs, a rising arrow, a light bulb, a calculator with buy and bell buttons, a calendar, and people analyzing data for investment and savings.

Simple Investing Terms Beginners Hear Every Day

Learn what stocks, bonds, ETFs, dividends, diversification, and volatility mean.

Nighttime scene of the New York Stock Exchange building with a large yellow 'NYSE' sign, a statue of a bull in front, surrounded by tall modern skyscrapers with Nasdaq and other financial data displays glowing in the cityscape.

What Is a Stock Exchange? NYSE, Nasdaq, and Others

Learn how NYSE, Nasdaq, and other markets work as organized places where buyers and sellers trade stocks, explained for beginner investors.

Illustration depicting financial concepts: upper left shows assets with a house, stack of money, coins, and a car; upper right shows liabilities with a loan document, credit cards, money, and an upward trending graph; lower left shows equity with a handshake, a house, money, and an upward trend arrow; lower right shows debt with a distressed person, a chain, a ball, and an upward trend arrow.

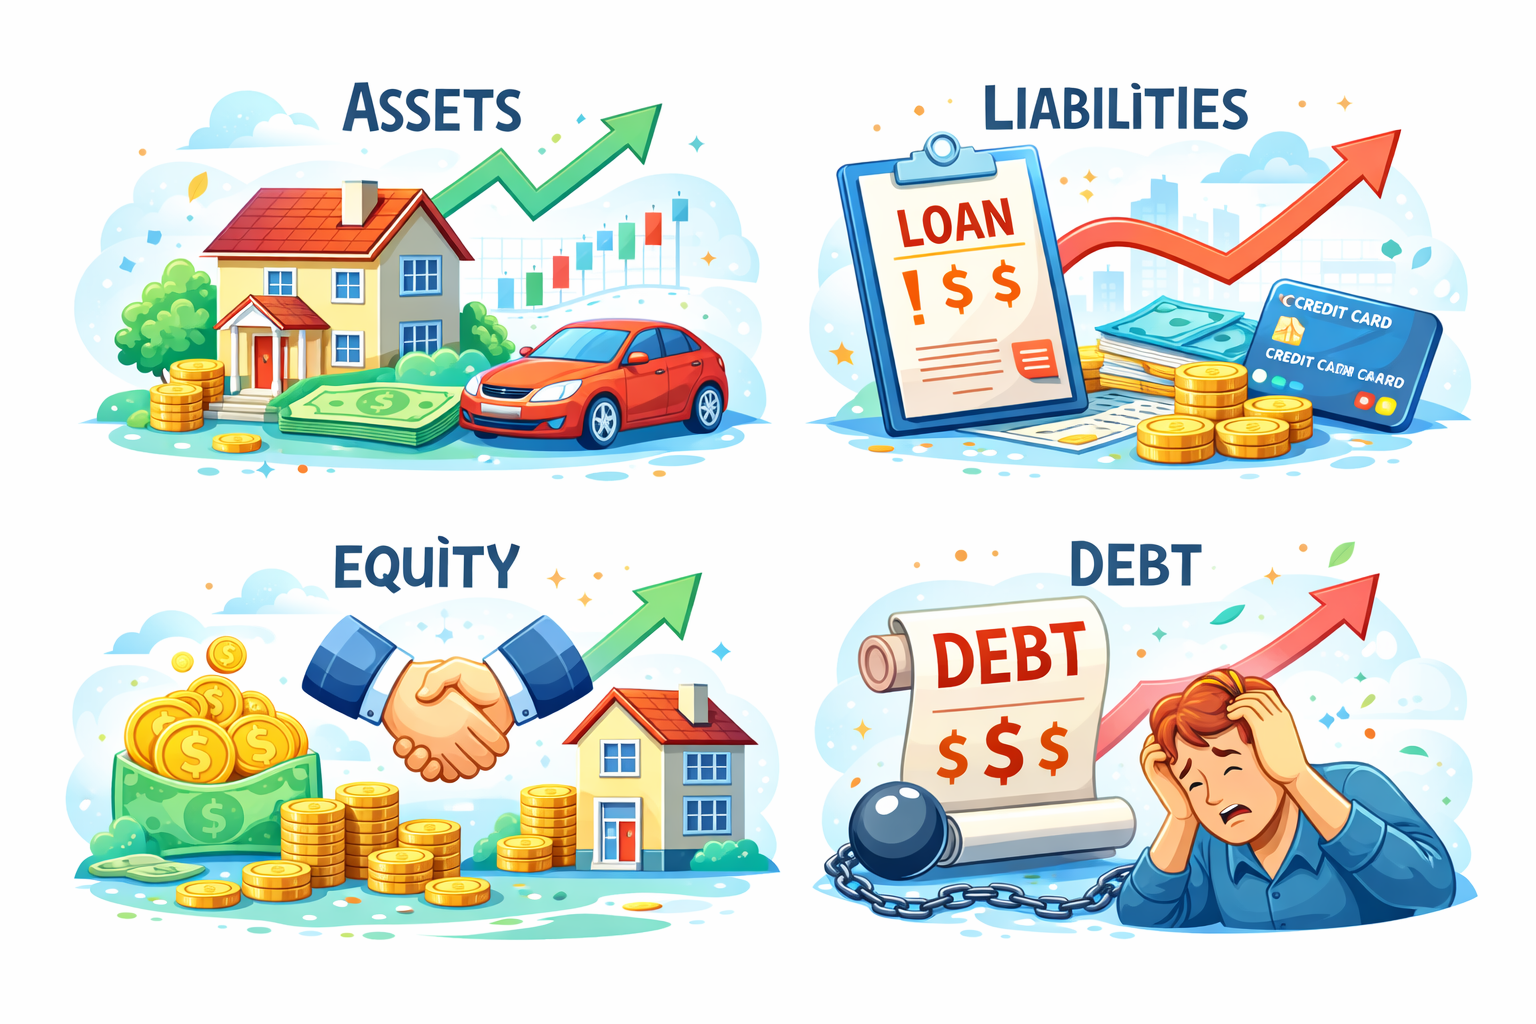
Simple Definitions: Assets, Liabilities, Equity, and Debt

Assets, liabilities, equity and debt explained in simple terms for beginners. Learn what you own, what you owe, and what is really left over.

A colorful illustration depicting various investment options such as stocks, bonds, cash, real estate, and more. The image features a rising dollar sign, a house with a 'For Sale' sign, coins, dollar bills, and investment icons against a cityscape background with clouds and stars.

Asset Classes: Stocks, Bonds, Cash, Real Estate, and More

Learn how stocks, bonds, cash, real estate, and more fit together to shape risk and return for beginner investors.

Illustration of financial growth and investment concepts with coins, cash, a stock certificate, dividends on a clipboard, a bag of money, a house of finance, a calendar, and a debt ball and chain.

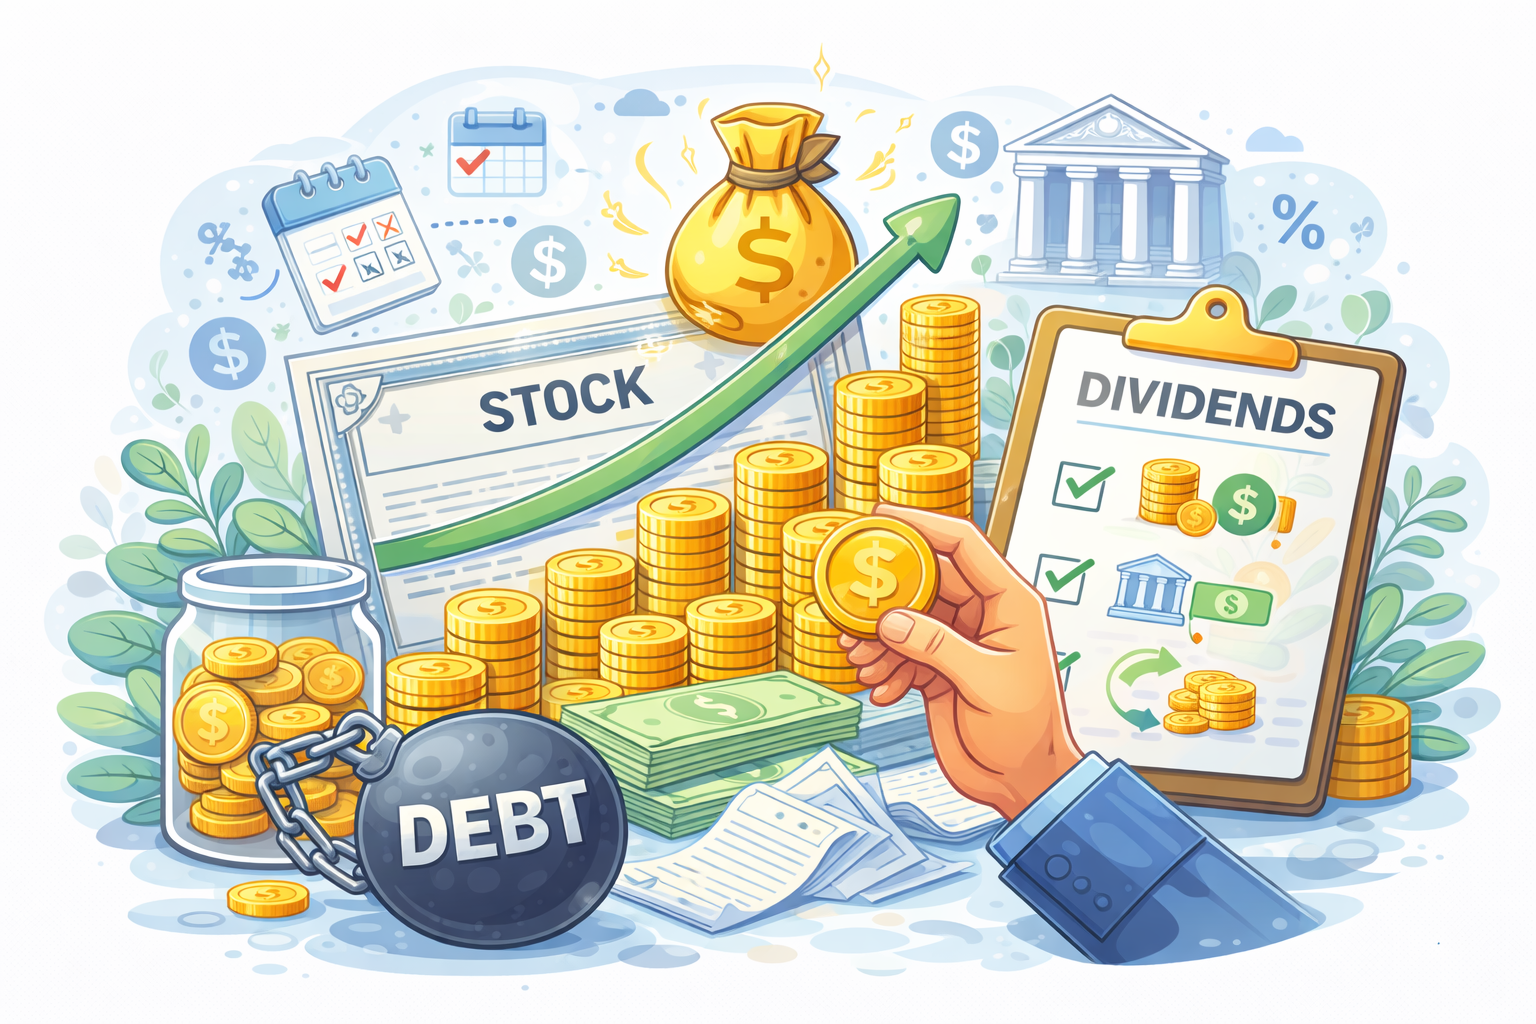
Dividends in Plain English

Learn what dividends are, how they work, what dividend yield means, and the benefits and risks for beginner stock market investors.

A graphic illustration showing three investment strategies: saving with a piggy bank and upward stock chart, investing with a tree growing on coins and an upward stock graph, and speculating with dice, coins, and a fluctuating red halftone background.

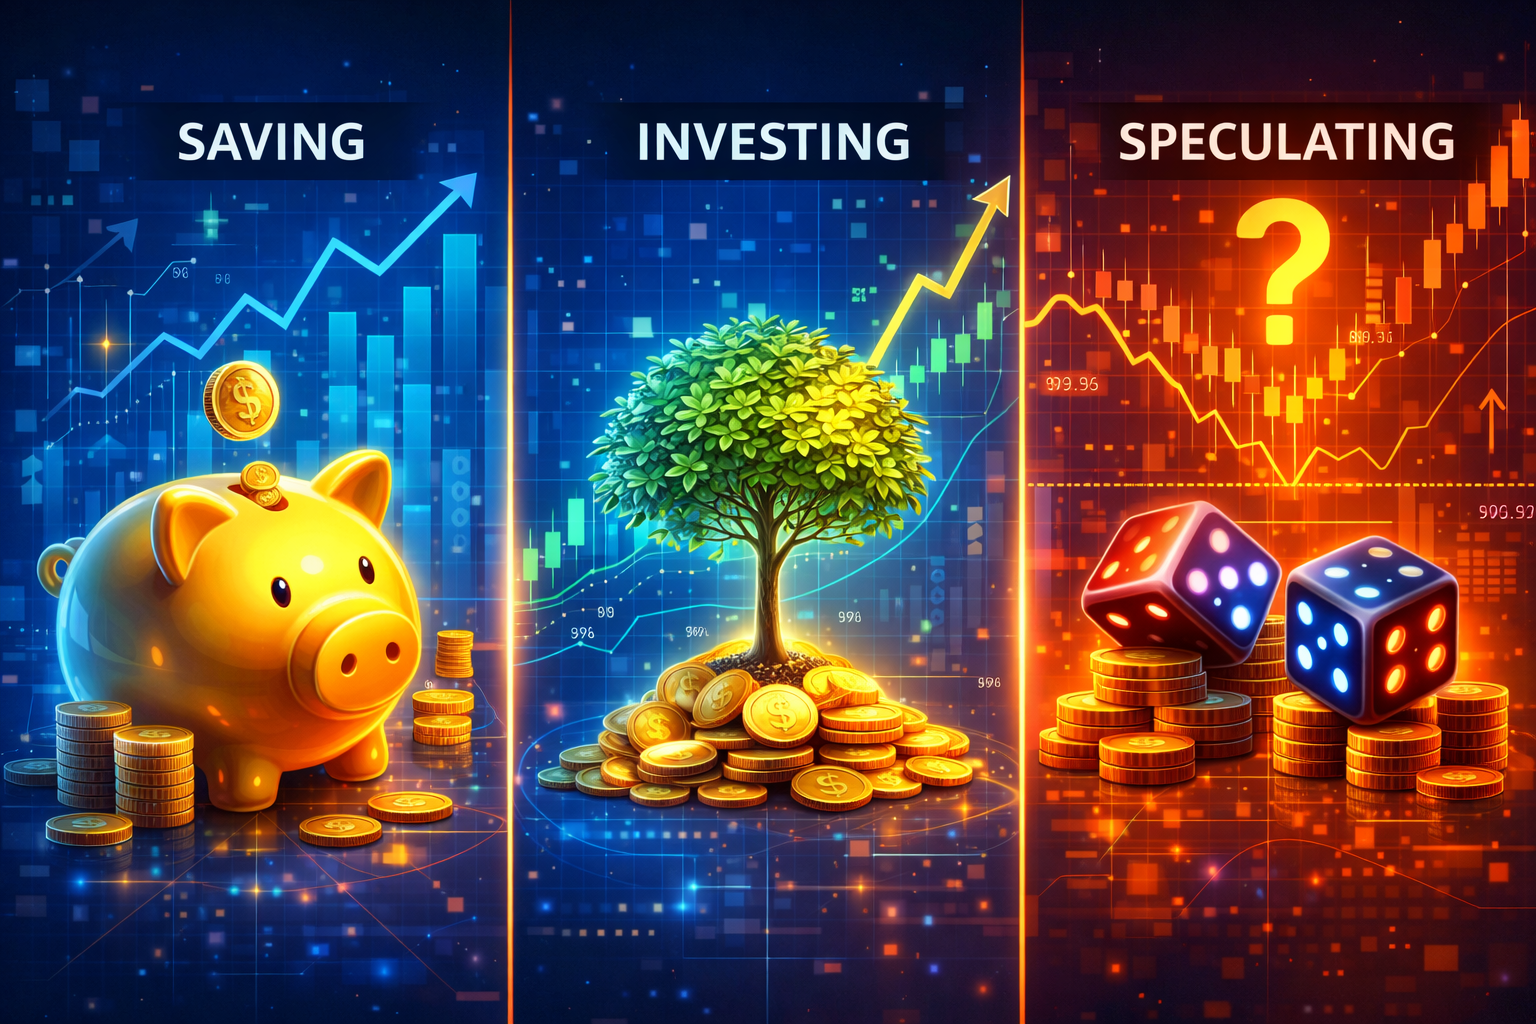
What Investing Is (and Is Not)

Saving vs investing vs speculating explained. Learn how they differ in risk, time horizon, and goals so beginners know what they are really doing.

A vintage alarm clock shows 11:55 pm in an outdoor setting during night with a full moon, stars, and trees in the background.

Trading Hours and What “After-Hours” Means

Learn when the stock market is open, how extended-hours trading works, and the extra risks for beginners.

Two digital tablets held in hands, with stock market graphs in the background. The left tablet shows a 'Buy' and 'Sell' button, representing market orders, while the right tablet displays prices with 'Buy Limit' and 'Sell Limit' options, representing limit orders.

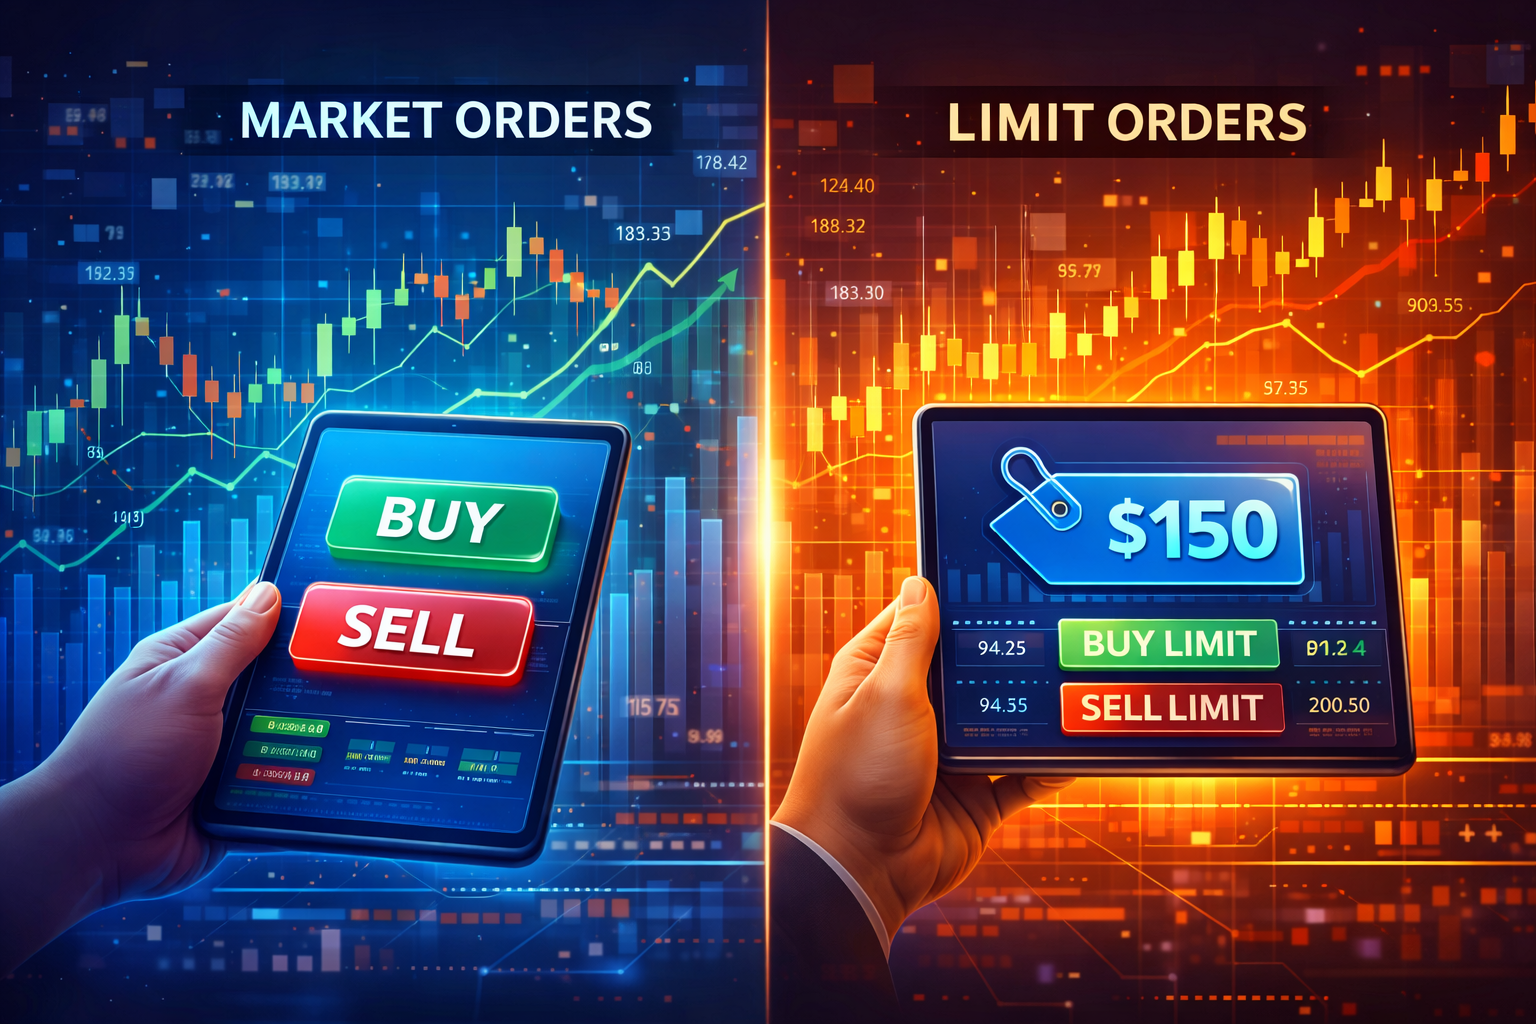
Market Orders vs Limit Orders (and Why It Matters)

Learn how market and limit orders work, their trade-offs, and why the choice matters for investors.

Colored infographic illustrating financial concepts: P/E ratio with a magnifying glass and coins, debt/equity with chained bars labeled 'Debt' and 'Equity', and margin with bags labeled 'Cost' and 'Profit', arrows showing financial growth, money, charts, and leaves.

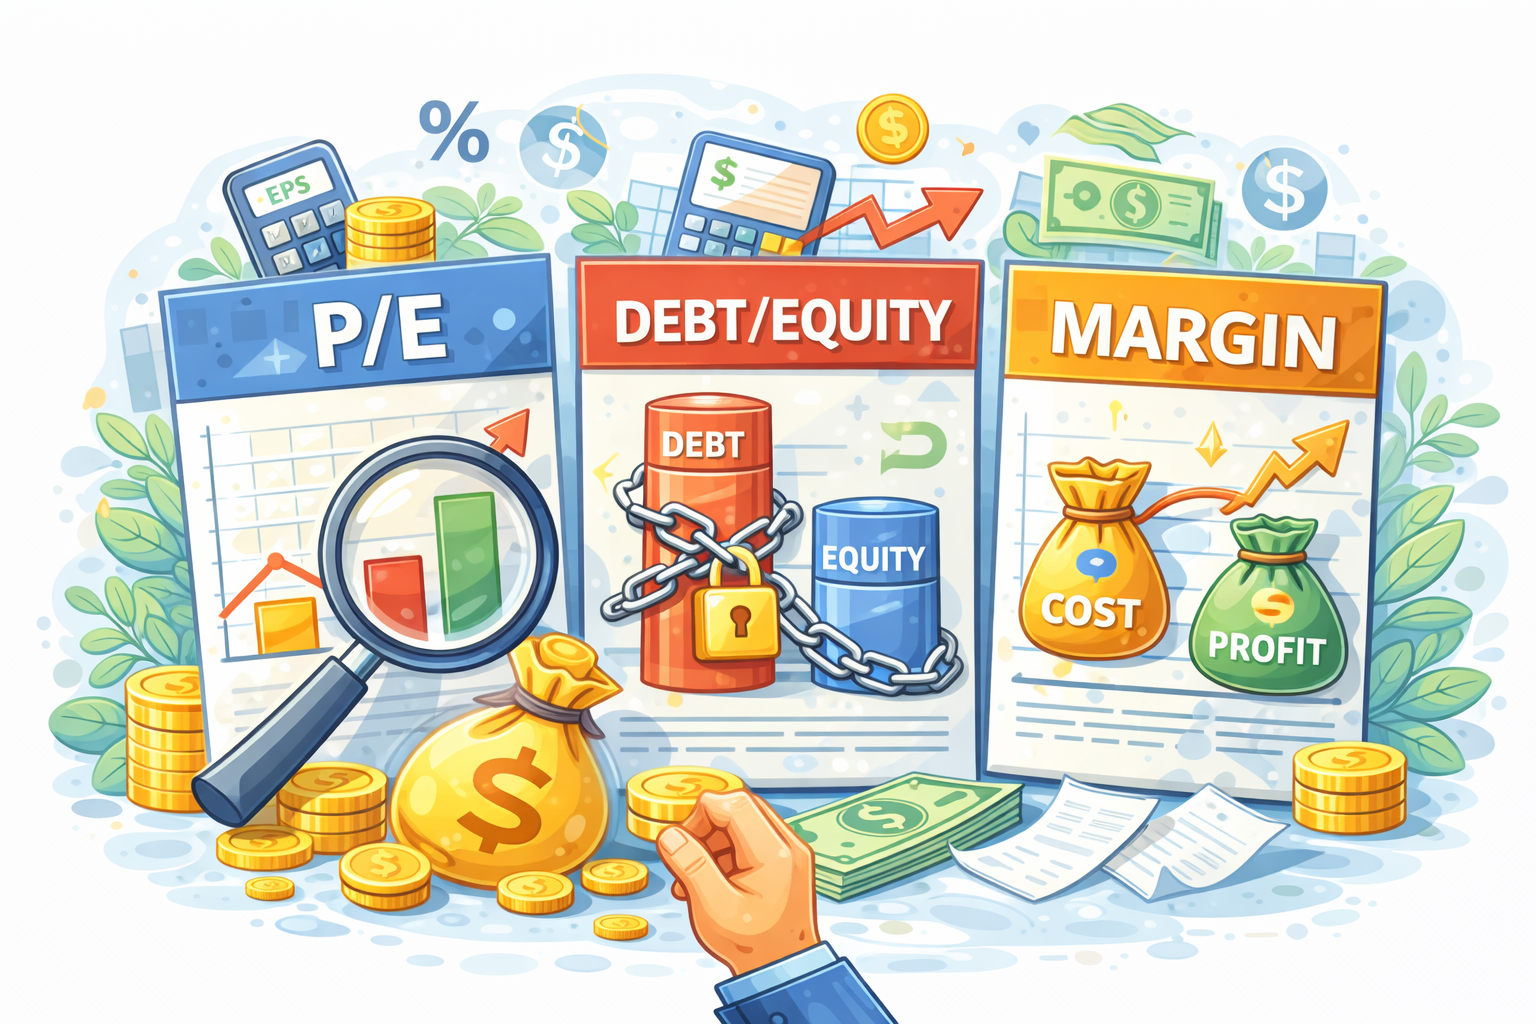
Key Ratios Beginners Hear About

Learn what P/E, debt-to-equity, and profit margin mean, how they are calculated, and what they can tell you about a company.